 View Video No. 1 of 35
Downloading CasaXPS and Licensing a PC
This video describes how to download CasaXPS to a PC and license a PC for use with CasaXPS.
Site Academic Licenses for CasaXPS are available for many universities. Current students and employee of universities with a site academic license may license a PC for use with CasaXPS for the duration of their tenure at the University. To see the current list of site academic licenses, press the button labelled License List
 View Video No. 2 of 35
Exploring the Relationship between Detector Arrays and Transmission Correction
Modern XPS instruments enhance sensitivity by collecting energy dispersed signal in parallel. An array of detectors are arranged along the exit aperture in the energy dispersive direction of the HSA, such that for each retard ratio applied to the transfer lens column, a narrow energy spectrum is obtained. Moreover, when the retard ratio is scanned to form a survey spectrum, each detector array element generates a spectrum. In this video, the characteristic shapes often seen in the transmission response to lower initial kinetic energy electrons is explored through the use of spectra acquired from different detector-channels of a detector array.
Transmission Curve Calculated for Ulvac PHI Versa Probe II
The Versa Probe II performance was compatible with computing, for the given lens mode, a transmission curve that would allow the use of theoretically derived relative sensitivity factors. The alignment of transmission corrected spectra implies that pass energy is available to users of the Versa Probe II to optimise sensitivity and energy-resolution when collecting spectra for use in quantification of a sample. Moreover, the transmission corrected spectra for the Versa Probe II offer reference spectra to which other instruments could be calibrated for transmission by computation of relative transmission functions.
 View Video No. 4 of 35
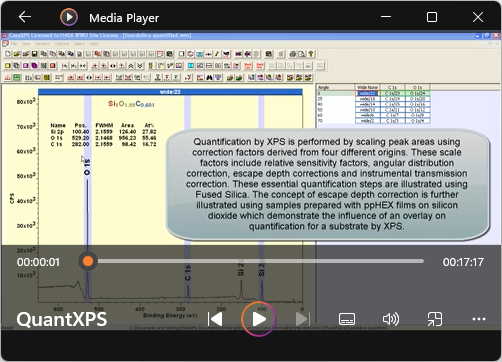
Quantification by XPS: An Overview
When attempting to understand X-ray Photoelectron Spectroscopy (XPS) data, it is helpful to have an appreciation of how an XPS instrument generates energy spectra from electrons emitted by irradiating a sample with X-rays. The reason behind this statement is that XPS instruments provide intensity as a function of kinetic energy, but other than evidencing the presence of elements in the sample, these as-measured spectra are not a measure for the amount of substance in the sample. Photoelectron peak area (CPS eV) is correlated with amount of substance, but to quantify the composition of a sample the raw data must be corrected for the physics of photon-electron scattering, the physics of electron-electron scattering and the physics involved in measuring photoelectrons.
 View Video No. 5 of 35
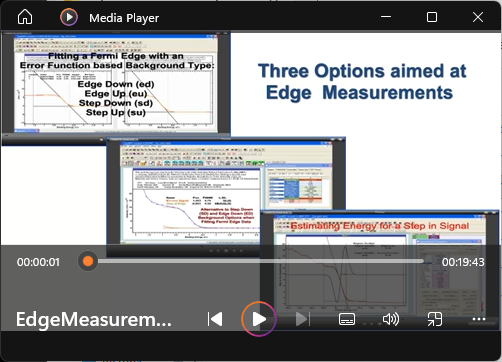
Fitting the Fermi Edge
Three videos within one illustrate three options for fitting the Fermi Edge. Two of these videos fit the Fermi edge using background types Step Up and Edge Down and the third video demonstrates fitting to a Fermi Edge a peak model using components that model a step in intensity.
 View Video No. 6 of 35
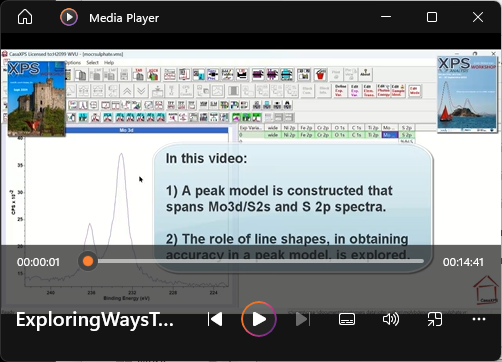
Exploring ways to Improve Accuracy in Peak Models
Construction of a peak model for Mo 3d, S 2s and S 2p is performed by first constructing two peak models, one for Mo3d/S2s and the second for S2p spectra. The data and the peak models are combined into a single irregular step-sized spectrum, which permits relational constraints to exist between S 2s and S 2p components, for example.
Relative Transmission Functions applied to Ulvac PHI Genesis Spectra
A solution to transmission correction for modern spectrometers (that enables quantification by making use of the tabulated sensitivity factors appropriate for older spectrometers) is to construct relative transmission functions for each lens mode and each pass energy of the lens mode. A relative transmission function requires a standard transmission corrected spectrum obtained from a standard sample. Each transmission function for a modern spectrometer is constructed such that a spectrum measured on a modern spectrometer from the standard sample (e.g. sputter cleaned gold foil) is transformed to the reference spectrum, with the exception of the photoelectron peak shapes. Armed with a reference spectrum, the response of modern spectrometers can be corrected to ensure spectra measured using any pass energy, after transmission correction, returns alignment with the reference spectrum.
 View Video No. 8 of 35
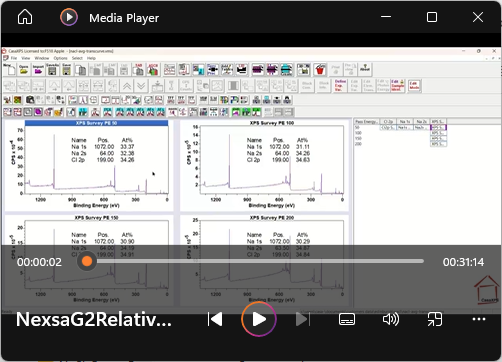
Exploring the use of Relative Transmission Functions in Quantification by XPS
If for any initial kinetic energy of electrons emitted from a sample the same constant number of electrons with the same angular distribution are available for detection by a spectrometer designed for XPS, the actual number of electrons detected is not a constant but varies with the energy of the electrons. Therefore, quantification of a sample by XPS must include a calibration of the intensity scale as a function of the initial kinetic energy of photoelectrons. In this video, two methods are considered for computing transmission correction for a Thermo Fisher Scientific NEXSA G2. The resulting transmission functions are tested using photoelectron peaks Na 1s, Na 2s and Cl 2p emitted from NaCl.
 View Video No. 9 of 35
Calculating Transmission Functions for a Lens Mode
Quantification by XPS requires adjustments to as-acquired peak areas to account for the physics of photoemission and also to account for the physics of the instrument used to acquire the spectra. The adjustment for the physics of the instrument is generally referred as correcting for transmission response to measuring electrons with a range of initial kinetic energies, which is performed by dividing signal by an appropriate transmission function. Each lens mode and pass energy has a different transmission response to kinetic energy, however, for systematically tuned instruments, the transmission function for a given transfer lens-mode can be calculated from a function of the retard ratio (kinetic energy divided by pass energy). In this video, a method is described for computing, for one lens mode, the function of retard ratio that allows quantification by XPS. The results of quantification and comparing spectra to a spectrum (John Walton) corrected by the NPL transmission correction method verifies that the method works well.
 View Video No. 10 of 35
Calculating Transmission Functions for a Lens Mode (Part 2)
In Part 1 of two videos, a transmission function for a lens mode was calculated by extracting from regions the intensity at a kinetic energy, where intensity represents integrated signal over an energy interval. In Part 2, the intensity relationship to kinetic energy is directly obtained from signal selected to be background signal only. The transmission curve is fitted to the more numerous data obtained from survey spectra, which is useful for situations where the number of pass energies available to measure survey data is limited.
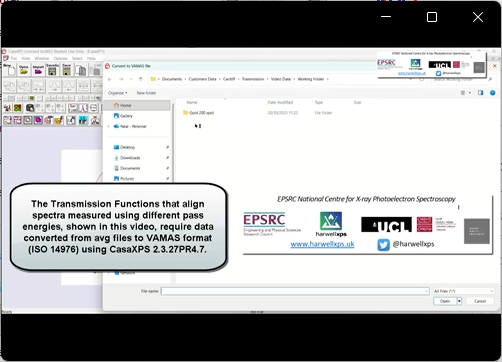
Quantification by XPS using Different Pass Energies
X-ray Photoelectron Spectrometer’s performance in terms of energy resolution and sensitivity is dependent on the collimation transfer lens system and the pass energy for the hemispherical analyser (HSA). There is a trade-off between energy resolution and sensitivity, therefore spectra for which little chemical state information is within photoelectron peaks, a high pass energy allows fast acquisition of spectra with sufficient signal-to-noise for elemental quantification. However, when chemical state results in binding energy shifts for photoelectrons emitted from a specific core-level, or there is an overlap between signal from photoelectrons of different elements, then lower pass energies that limit count-rate are the preferred acquisition mode. Narrow scans in energy are typically used to target spectra to specific core-levels, but using a low pass energy necessarily increases the acquisition time required to achieve the desired signal-to-noise ratio for meaningful data treatment. Ideally, quantification of a sample would involve the use of high pass energy when acquiring the bulk of the signal and making use of low pass energy only when necessary. The problem that must be overcome to allow the quantification through mixed pass energies is accounting for the variation in performance of an XPS instrument a different pass energy of the same transfer lens mode at different kinetic energy of photoelectrons. This video is an illustration of how it is possible to perform quantification of a sample using different pass energies.
 View Video No. 12 of 35
Exploring the transmission curves included in Thermo Fisher Scientific K-Alpha+ Data
Transmission functions are used to correct spectral intensities for variations due to an instruments response to measuring signal at different kinetic energies. The success of quantification by XPS is dependent on these transmission functions. In this video, an example of spectra acquired from a K-Alpha+ is used to illustrate how Thermo Fisher Scientific spectra are corrected for transmission influences.
 View Video No. 13 of 35
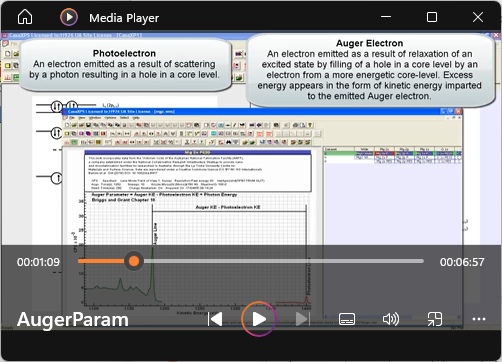
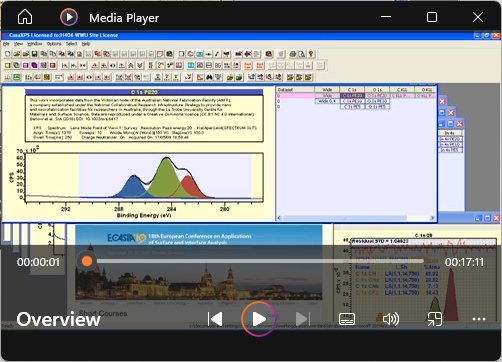
Computing Auger Parameter from MgO Spectra
This video illustrates how the Custom Report is used to calculate Auger Parameters used in Wagner Plots. The formulae file used in the video to populate the Name/Formula table is included in the zip file that is downloaded using the button to the right of this section.
This work incorporates data from the Victorian node of the Australian National Fabrication Facility (ANFF), a company established under the National Collaborative Research Infrastructure Strategy to provide nano and microfabrication facilities for researchers in Australia, through the La Trobe University Centre for Materials and Surface Science. Data are reproduced under a Creative Commons licence (CC BY-NC 4.0 International). Barlow et al SIA (2018) DOI: 10.1002/sia.6417
 View Video No. 14 of 35
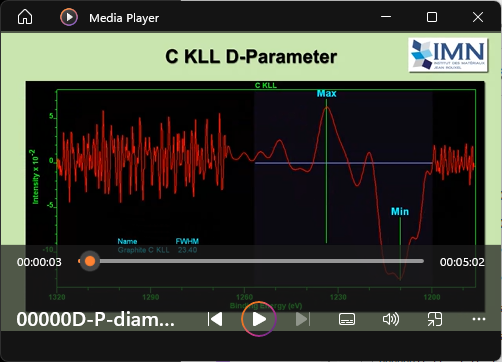
D Parameter
C KLL Auger peaks from diamond and graphite are used to illustrate how to compute the D-Parameter in CasaXPS. Auger peaks are differentiated using synthetically derived curves rather than simply performing a Savitzky Golay differentiation directly applied to raw data. The Poly Regression background type in CasaXPS is applied to the data to obtain a smooth approximation to the data. An option on the Test Data property page of the Spectrum Processing dialog window is used to differentiate the polynomial approximation to the Auger peaks and the SP2SP3 background type applied to the differentiated data envelope measures the D-Parameter for a boron-doped diamond and graphite sample.
 View Video No. 15 of 35
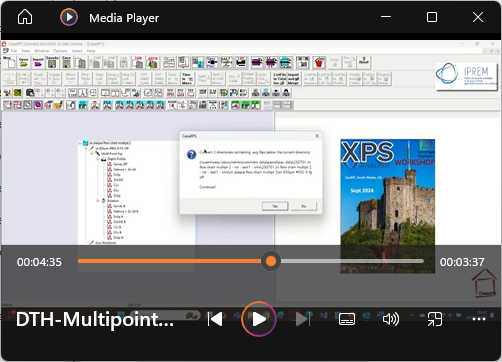
Converting Avantage Data measured using a Multipoint Flowchart Specification
Avantage allows the specification of an experiment by including in the flowchart a list of stage positions (Multipoint) that moves the sample to a new analysis position before completing a sequence of measurements. The combination of a multipoint specification and depth profiles performed at each point results in ASCII avg files that require conversion to VAMAS format using the .dth conversion filter rather than the older .dvg filter. In this video, an example of a multipoint control object that manages a depth profile and a set of iterations is used to illustrate how these types of experiments are converted to VAMAS format.
 View Video No. 16 of 35
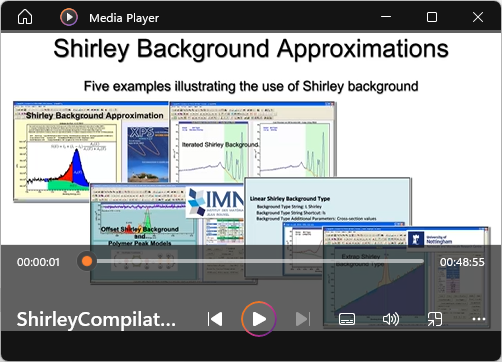
Shirley Background: Five Videos in One
The Shirley background is arguably the most common background used to account for signal resulting from inelastic scattering of electrons emitted from within a sample. While applicable to many photoelectron peaks, the Shirley algorithm in a rudimentary form is inappropriate as a generally applicable background algorithm. Within this video is a compilation of videos, which look at the Shirley algorithm and how the shape of the Shirley background can be adjusted to accommodate photoelectron peaks for which the basic Shirley algorithm is inappropriate. The initial video introduces the Shirley algorithm, which is followed by a video that explains how the iterations used to compute the Shirley background can be limited to soften the step in intensity across photoemission peaks. The third video within the compilation considers an option for offsetting in energy the Shirley shape. An offset in energy to the background generated by a photoelectron peak is a possible solution to modelling for materials with significant band gaps. The final two videos are concerned with allowing for scenarios where the spectrum includes a peak on a declining background signal.
 View Video No. 17 of 35
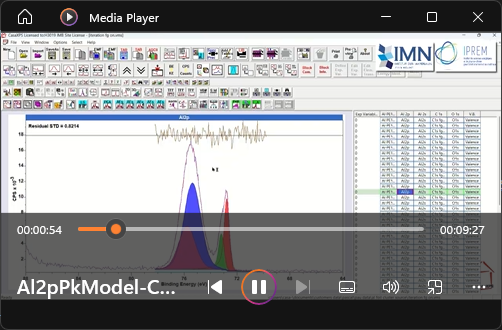
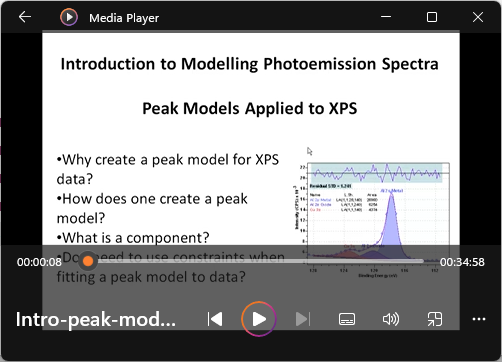
Abstract
Layered materials are technologically important in the search for energy storage devices. X-ray Photoelectron Spectroscopy (XPS) is often used to characterise the chemistry of layered materials. However, before meaningful analysis of materials can be made by XPS, there is a need to investigate how a particular sample interacts with XPS instrumentation. In this paper a simple example of aluminium foil is used to demonstrate the consequences of choices made when XPS is performed on a material with two layers of oxide between a bulk metal substrate. The results presented demonstrate how these choices alter the spectra measured, and through extended periods of acquisition cycles, the response of a sample to XPS can be characterised, understood, and mitigated by experimental design and appropriate peak-model construction.
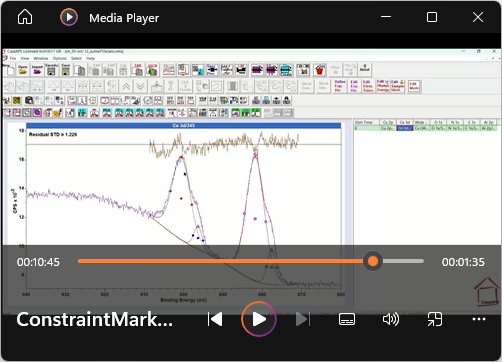
 View Video No. 18 of 35
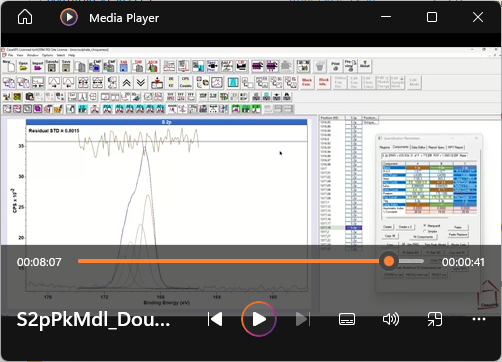
Peak Models and Correlated Signal: Sulphate S 2p
Constraints to optimisation parameters are an important tool in constructing peak models with scientific meaning. Relational constraints are particularly appropriate when spectra include highly correlated signal. However, XPS often yields data for which sample and instrumental factors result in subtle changes in spectra that do not relate directly to sample chemistry that make difficult a precise fit to data for a particular peak model. When the quality of fit deteriorates, there is a temptation to relax relational constraints to permit an improved fit of a peak model to data, but the act of relaxing relational constraints can have detrimental impact on the accuracy of the chemical information desired. This video makes use of XPS of sulphates in a sample to examine the consequences of relaxing positional relational constraints.
 View Video No. 19 of 35
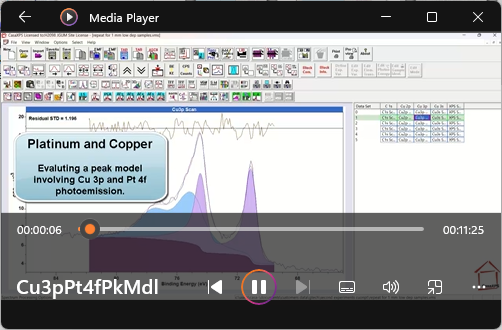
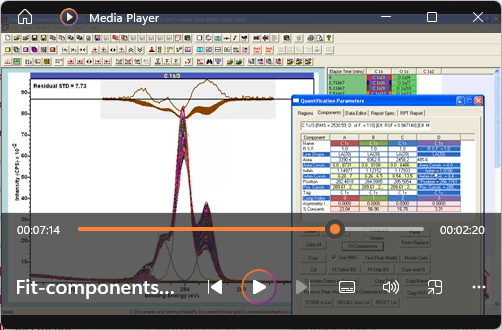
Abstract
X-ray Photoelectron Spectroscopy spectra peak models, designed to partition photoemission signals emanating from different elements or chemical states within an atom, are fitted to data limited to an energy interval over which inelastically scattered photoemission signal can be estimated. When constructing a peak model, the intention of adding a background curve is that it will encompass the same energy interval as the photoelectron resonance signal targeted by the peak model. While the choice of background approximation and line shapes of components to the peak model requires careful consideration, the energy interval used to define the data to which the peak model is optimized has a significant impact on the final peak model. More importantly, the relationship between the background intensity and data intensity at the start and end of the energy interval dictates the line shapes used in the peak model. In this work, we devise a method to peak fit a complex overlapping Cu 3p and Pt 4f XPS peak structure to perform the elemental quantification. We first use an Al 2s peak to illustrate how background curves approach data at the limits of the energy interval over which the background is defined, influencing the analysis of XPS spectra. Next, we demonstrate the nature of interactions between specific line shapes (Voigt and pseudo-Voigt profiles) suitable for photoemission peaks and a specific background curve (Shirley), a peak model is presented that includes components to the peak model that accommodates background intensity during fitting of the peak model to data. The peak model allowed us to quantify the contributions of Pt 4f peaks emanating from the substrate that exhibits strong asymmetry in the presence of the inhomogeneously distributed Cu species mostly of Lorentzian character.
 View Video No. 20 of 35
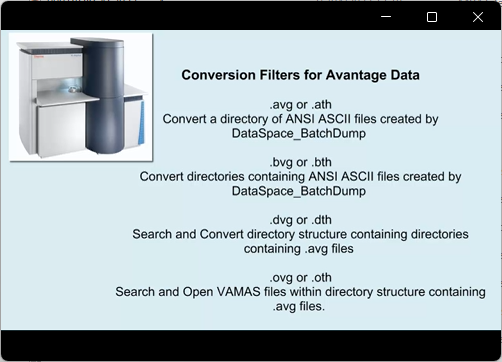
Converting Avantage Data to ISO 14976 (VAMAS) Format used by CasaXPS
Avantage data, when converted from the binary files (file extension VGD) to ASCII files with file extension avg, are converted to VAMAS format by CasaXPS using the Convert to VAMAS File Dialog window. This video describes a range of conversion filters in CasaXPS that convert Avantage data held within folder structures.
 View Video No. 21 of 35
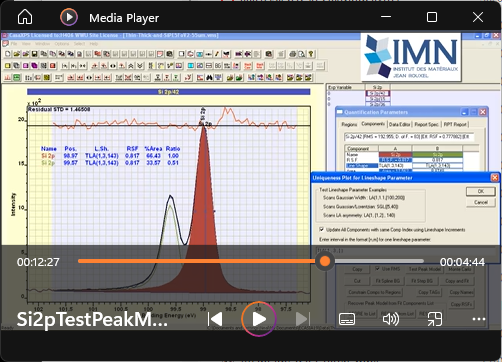
Constructing Line Shapes
The video is aimed at demonstrating how the Test Peak Model button (on the Components Property Page of the Quantification Parameters Dialog Window) is used to examine the influence of line shape parameters on outcomes for a Peak Model when fitted to spectra. The video makes use of elemental Si 2p doublet photoelectrons to illustrate how asymmetric line shapes alone are a constraint during optimisation sufficient to produce the expected intensity-ratio for p-orbital peaks.
 View Video No. 22 of 35
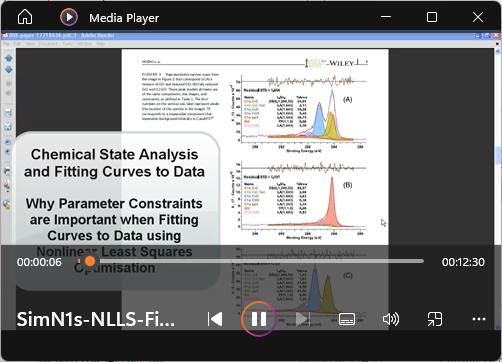
Peak Models and Parameter Constraints
Guide to XPS data analysis: Applying appropriate constraints to synthetic peaks in XPS peak fitting Cite as: J. Vac. Sci. Technol. A 40, 063201 (2022); https://doi.org/10.1116/6.0001975
The importance of using parameter constraints when fitting peak models to data is demonstrated within this video. The concepts described in the video were applied to peak models to measure different proportions of GO and rGO that appear in the paper: Moeini, Behnam, et al. "Definition of a new (Doniach‐Sunjic‐Shirley) peak shape for fitting asymmetric signals applied to reduced graphene oxide/graphene oxide XPS spectra." Surface and Interface Analysis 54.1 (2022): 67-77. https://doi.org/10.1002/sia.7021
 View Video No. 23 of 35
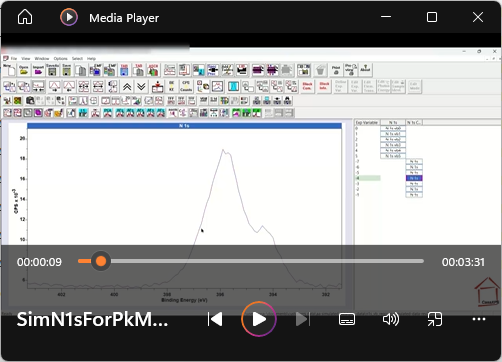
Constructing Data to Assess Appropriateness of a Peak Model
Understanding the limitations of peak models is an important part of XPS analysis. In this video, spectra are prepared that help test peak model constraints and line-shapes, by fitting the peak model to data with known properties, such as number of components that are required to obtain the information within the spectrum.
 View Video No. 24 of 35
Overview of CasaXPS
The toolbar buttons and dialog windows of CasaXPS are illustrated by a sequence of examples. The logical organisation for CasaXPS dialog windows and how these dialog windows relate to data within VAMAS files is presented in this video.
 View Video No. 25 of 35
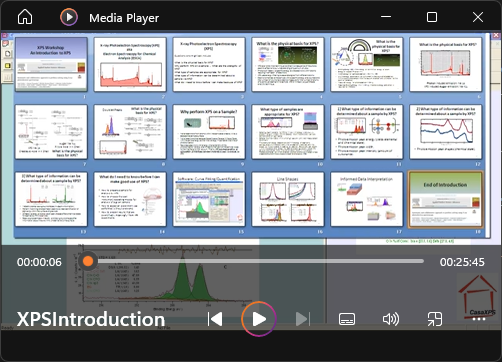
Introduction to X-ray Photoelectron Spectroscopy
The video is aimed at people new to XPS that would like to know the reason for photoelectron peaks, Auger peaks and background signal in energy spectra. The spectrometer used to acquire energy spectra is described as well as the basics of spectral analysis techniques.
 View Video No. 26 of 35
XPS of Sucrose: Fitting Curves to Data
Fitting curves to data is central to separation of chemical state information within XPS data. The example of constructing a peak model for C 1s data collected from a sucrose sample was presented at the UKSAF2022 Winter meeting, where a more nuanced interpretation of spectra is developed by combining traditional peak model techniques with techniques based in linear algebra. The approach described herein has been applied to both polymers and metal oxides.
 View Video No. 27 of 35
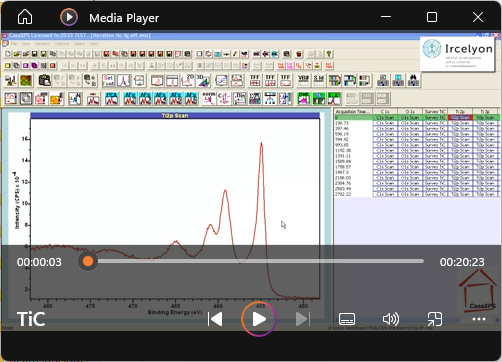
Asymmetric Line Shape applied to Titanium Carbide
In this video, peak models are constructed for Ti 2p and C 1s that isolate signal emanating from titanium carbide. Asymmetry, evident in the photoemission peaks, is modelled using an asymmetric line shape for both Ti 2p and C 1s photoemission. Once constructed and fitted to data, these peak models are used to show that the 1:1 ratio expected for titanium carbide is attainable and these peak models represent a means of separating TiC from adventitious-contamination and oxidized-titanium, both of which are also evident in XPS spectra measured from the surface of the TiC sample.
 View Video No. 28 of 35
Introduction to Analysis of XPS by Fitting Curves to Spectral Data
Chemical state information about an atom is often obtained by constructing a model for a photoemission spectrum, constructed using component peaks, representing different elements and/or chemical state of an element, then fitting the peak model to data for which a background curve has been removed. The video discussing concepts associated with fitting peak models to data, providing an introduction to those people new to XPS.
 View Video No. 29 of 35
Peak Model Design: Constraining Component Parameters
Physically meaningful peak models often require parameter constraints to prevent fitting of the peak model to data returning a mathematical fit without physical meaning. For example, the ratio of doublet peak intensities is determined by the physics of angular momentum for electrons in an atom. Similarly, components with full width at half maximum (FWHM) should never be narrower than the energy resolution for the operating mode used to collect spectra. If left unconstrained, fitting of component peak in a peak model may fit data, but the peak model is without any scientific meaning. The subject of this video is the important topic of managing constraints between components in a peak model.
 View Video No. 30 of 35
XPS Quantification by Example
Quantification in terms of elemental composition computed from X-ray photoelectron spectra, is appropriate for samples that are bulk-homogeneous in composition. Nevertheless, for heterogeneous samples, the steps taken to construct percentage atomic concentration are useful as a means of removing instrumental and topographical artefacts from results, and therefore permits a comparison of samples by XPS. This video is designed to illustrate the steps used to quantify XPS data, where corrections to peak intensities are performed in accordance with routine quantification by XPS.
 View Video No. 31 of 35
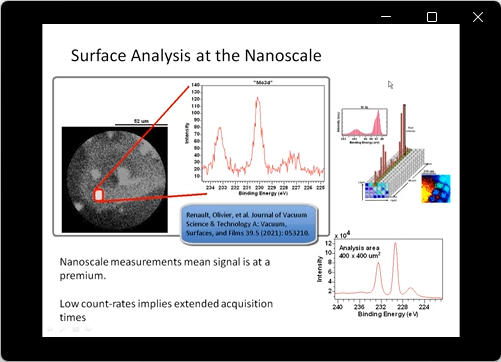
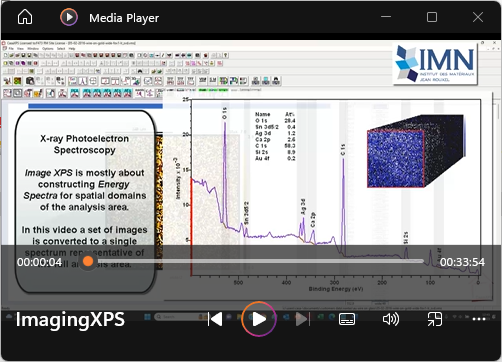
Introduction to Imaging X-ray Photoelectron Spectroscopy
Large area analysis by XPS of heterogeneous samples often yields spectra that are difficult to interpret. A sample that contains several domains of differing composition, at a scale open to the spatial-resolution of XPS, may be analysed using Imaging XPS. That is, data collected to include energy and spatial information about the sample is processed to yield spectroscopic information which can be correlated with specific domains on the surface. In this video, analysis techniques are explored that permit the extraction of spectra from smaller domains of the surface than the analysis area from which signal is collected. Spectra provide the desire elemental and chemical composition for each domain identified.
 View Video No. 32 of 35
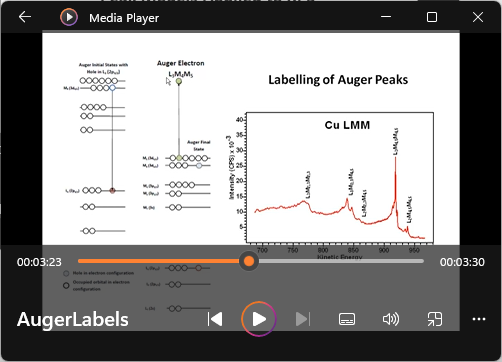
Labeling of Auger Peaks
XPS energy spectra include peaks that originate at the time an electron is scattered by a photon and peaks that are a secondary emission due to the Auger process. Auger peaks are a consequence of relaxation in energy of electrons bound to the ions created by photoionization and arise from multiple possible electron-electron transitions within the ion. The electrons in the ion drops to a lower energic state, where excess energy between the initial energy of the ion following photoionization and the final state of the ion is emission by ejecting an Auger electron. Auger peaks are labelled differently from photoelectron peaks for good reason, namely, the kinetic energy of Auger electrons is independent of photon energy that created the ion from which the Auger emission occurs. Emission of electrons due to photoionization depends on the energy of the photon. The video discusses the Auger process and explains the relationship between the labels used for photoelectrons and labels used for Auger electrons.
 View Video No. 33 of 35
XPS of Cellulose
Cellulose is an example of a material that responds to XPS by the creation of new chemistry not present in the as-received sample. While improvements in instrumentation may be seen in general as beneficial to surface science, recent studies have shown that the consequences for some materials are detrimental. In this video, these problems are illustrated through an analysis of cellulose spectra obtained during a degradation study.
Peak models are used to examine the surface chemistry of a sample. When multiple components in a peak model are fitted to data, the outcome depends on several factors, one of which is the use of constraints to parameters that are adjusted during fitting the model to data.
Peak model construction is dependent on an appreciation of the true number an nature of components to the peak model that are necessary for the sample as measured by XPS. PCA is used to help understand Cellulose when measured by XPS.
 View Video No. 34 of 35
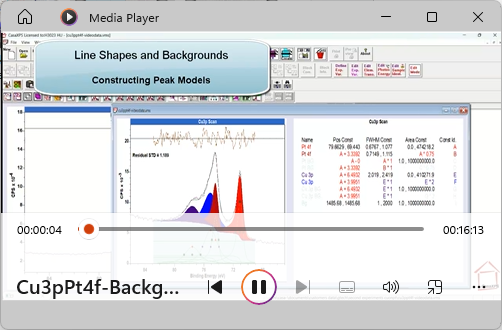
Line Shapes and Backgrounds
Peak models constructed for materials with significant bandgaps and relatively narrow full width at half maximum (FWHM) tend to make use of line shapes that are independent of the background approximation used to remove the inelastic scattered electron signal from raw intensities. However, the same is not necessarily true for materials with a narrow bandgap or no bandgap, namely, the background choice make a difference to the choice of line shape for components in a peak model. In this video, the role played by the background in the line shape is examined.
 View Video No. 35 of 35
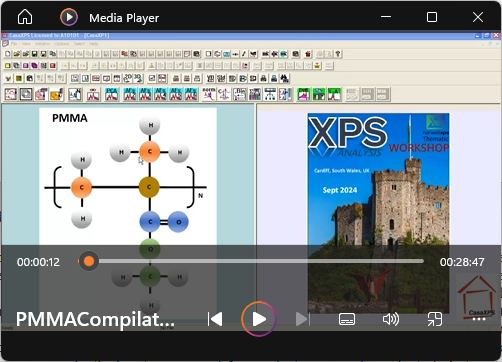
Abstract
This article provides an overview of data treatment aimed at understanding the X-ray Photoelectron Spectroscopy of poly methyl methacrylate. Videos detailing data analysis steps provide the technical aspects of the analysis, therefore the text below is designed to supplement videos by providing the context for the material and methods used in the analysis. Videos focus on methodology in CasaXPS rather than explanations of how and why these data treatments are performed. The combination of this article and videos provides a case study of fitting peak models to data. These peak models are constructed using mathematical line shapes to define components of the peak model. Components to peak models are designed to correlate photoemission signal with chemical state, which is achieved by identification of binding energy and relative intensity of photoemission signal that can be attributed to atoms in specific chemical environments. While the primary thrust of this case study is correlating components to chemical state, a technique to achieve this end makes use of linear algebraic concepts to facilitates the construction of a peak model that elucidates the nature of PMMA spectra, as-measured.